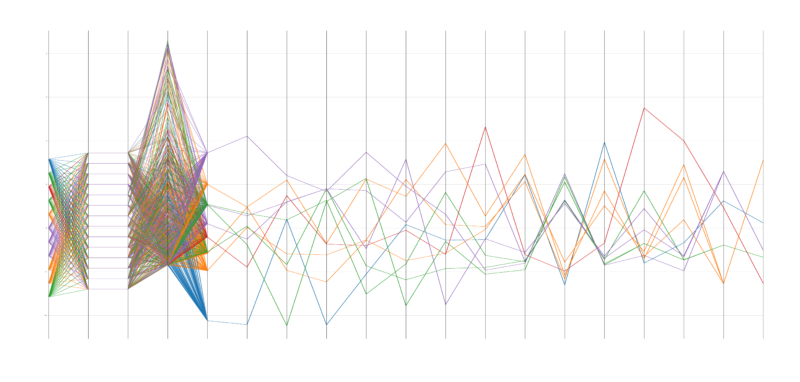
A multi-variate visualization of 11 countries’ performance across a variety of surveys. They are measured and grouped by color according to likeness with one another. Courtesy Seth Crider.
A multi-variate visualization of 11 countries’ performance across a variety of surveys. They are measured and grouped by color according to likeness with one another. Courtesy Seth Crider.